- التعليم
- Estrategias de Negociación
- Indicador Aroon: seguimiento del ciclo de vida de la tendencia
Indicador Aroon: seguimiento del ciclo de vida de la tendencia
Cada movimiento del mercado tiene un ritmo — inicio, aceleración y finalmente desaceleración. El indicador Aroon ayuda a los traders a entender en qué etapa de ese ciclo se encuentra la tendencia. Al medir cuándo el precio formó el último máximo o mínimo, Aroon muestra si la tendencia está ganando fuerza o perdiendo impulso — muchas veces antes de que sea evidente en el gráfico.
- Qué mide el indicador Aroon
- Cómo leer los datos
- Cómo usan los traders el Aroon
- Fortalezas y limitaciones del indicador Aroon
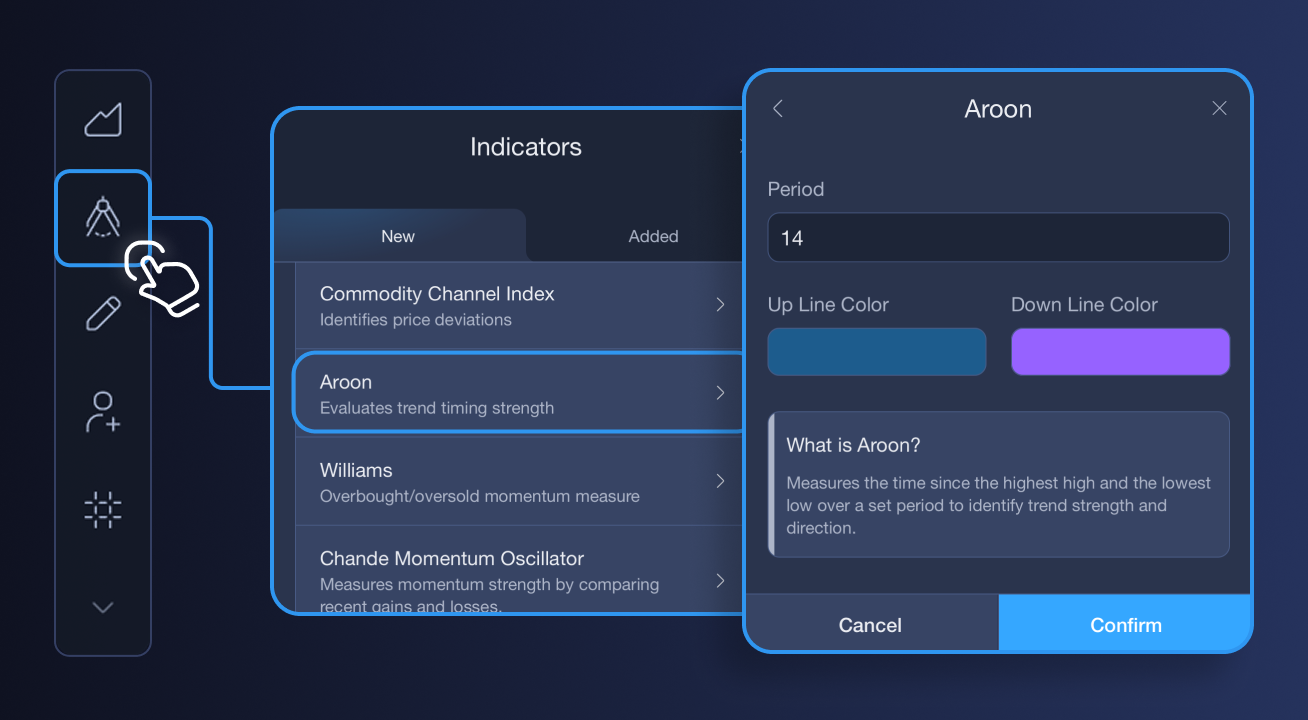
Qué mide el indicador Aroon
El Aroon está compuesto por dos líneas que se mueven entre 0 y 100:
- Aroon Up: mide cuánto tiempo ha pasado desde el último máximo.
- Aroon Down: mide cuánto tiempo ha pasado desde el último mínimo.
Cuando el Aroon Up se mantiene cerca de 100, el mercado está formando nuevos máximos constantemente — señal de un fuerte impulso alcista. Cuando el Aroon Down se mantiene cerca de 100, ocurre lo contrario — los vendedores dominan.
La relación entre estas dos líneas muestra si el mercado está en tendencia, perdiendo fuerza o en consolidación.
Cómo leer los datos
Entender la interacción entre Aroon Up y Aroon Down es clave:
- Tendencia alcista fuerte: Aroon Up cerca de 100, Aroon Down cerca de 0
- Tendencia bajista fuerte: Aroon Down cerca de 100, Aroon Up cerca de 0
- Cruce: cuando Aroon Up cruza por encima de Aroon Down, puede indicar una nueva fase alcista. El cruce contrario puede señalar un cambio bajista.
- Ambos cerca de 50: indica un mercado lateral o sin dirección clara.
A diferencia de muchos indicadores basados en el precio, Aroon se enfoca en el “tiempo” — cuánto tiempo ha pasado desde los últimos máximos y mínimos — lo que lo convierte en una forma única de medir la fuerza de la tendencia.
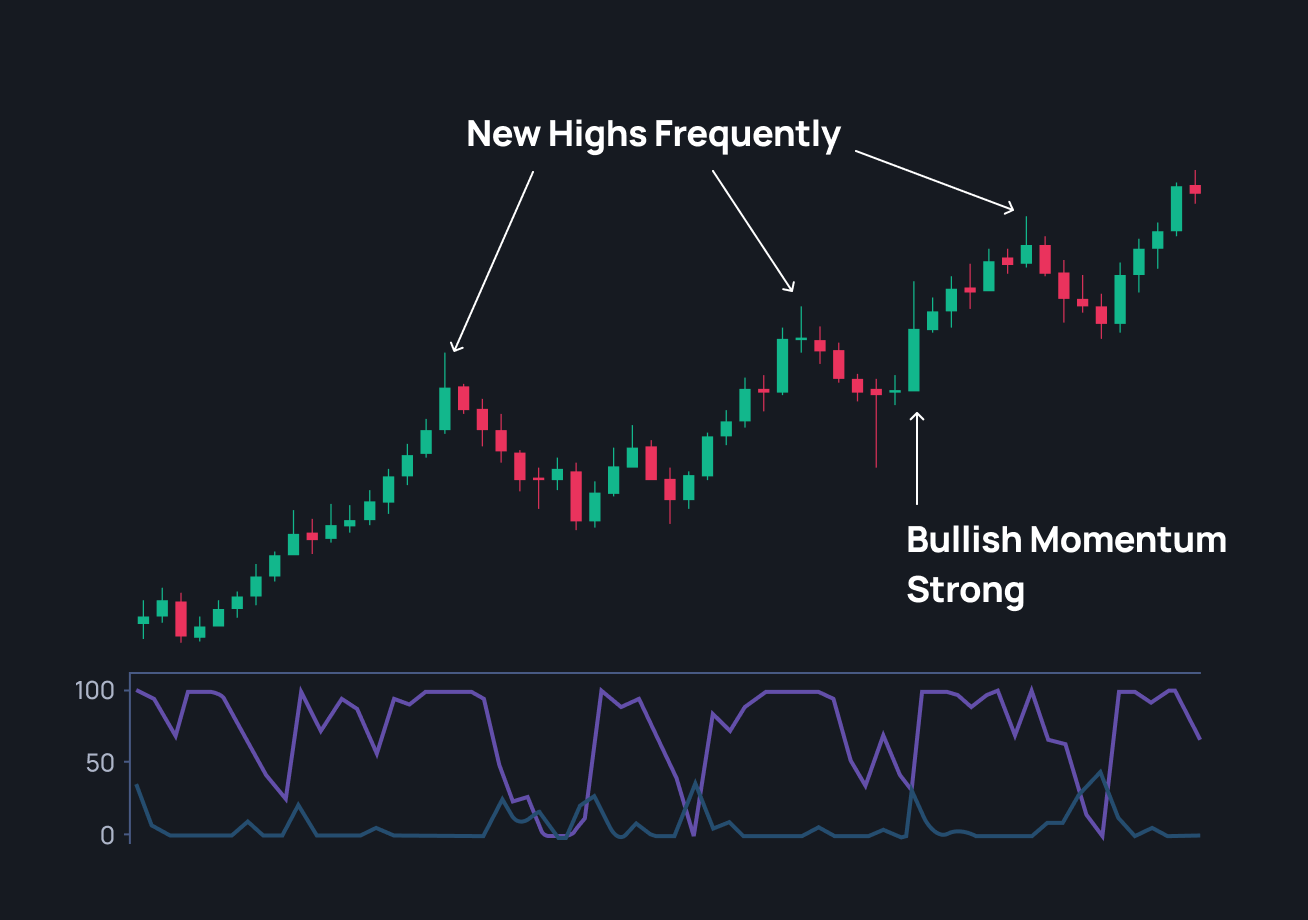
Cómo usan los traders el Aroon
1. Detectar nuevas tendencias
Cuando Aroon Up cruza por encima de Aroon Down y se mantiene alto, indica que los compradores están impulsando el precio de forma consistente. Los traders lo usan como una etapa temprana de tendencia alcista.
2. Detectar debilitamiento de la tendencia
Cuando ambas líneas se acercan a 50, indica pérdida de impulso y posible consolidación del mercado.
3. Confirmar reversals
Después de una tendencia alcista prolongada, si Aroon Down cruza por encima de Aroon Up y se mantiene alto, puede ser una señal temprana de cambio a tendencia bajista.
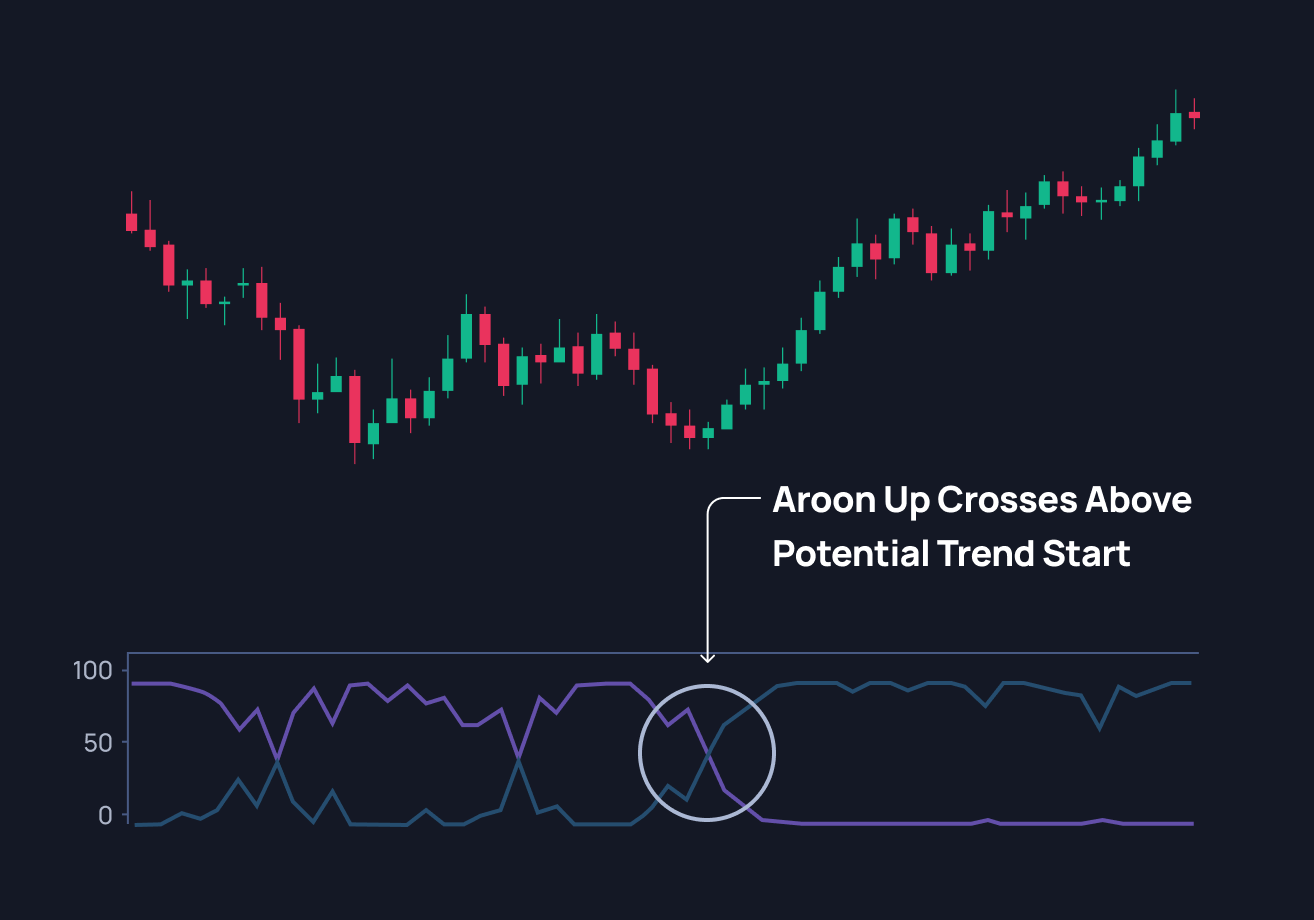
Fortalezas y limitaciones del indicador Aroon
Una de las razones por las que los traders prefieren Aroon es su claridad. Muestra la fuerza de la tendencia de forma simple, sin interpretaciones complejas. Usado correctamente, ayuda a seguir la dirección dominante del mercado y evitar entradas cuando el impulso se debilita.
- Proporciona señales tempranas de cambios en la fuerza de la tendencia
- Muestra claramente si el impulso está aumentando o disminuyendo
- Funciona en distintos marcos temporales (corto plazo y swing trading)
Sin embargo, el indicador Aroon no es perfecto:
- Puede generar señales falsas en mercados laterales o volátiles
- Puede tener cierto retraso tras movimientos bruscos o reversals fuertes
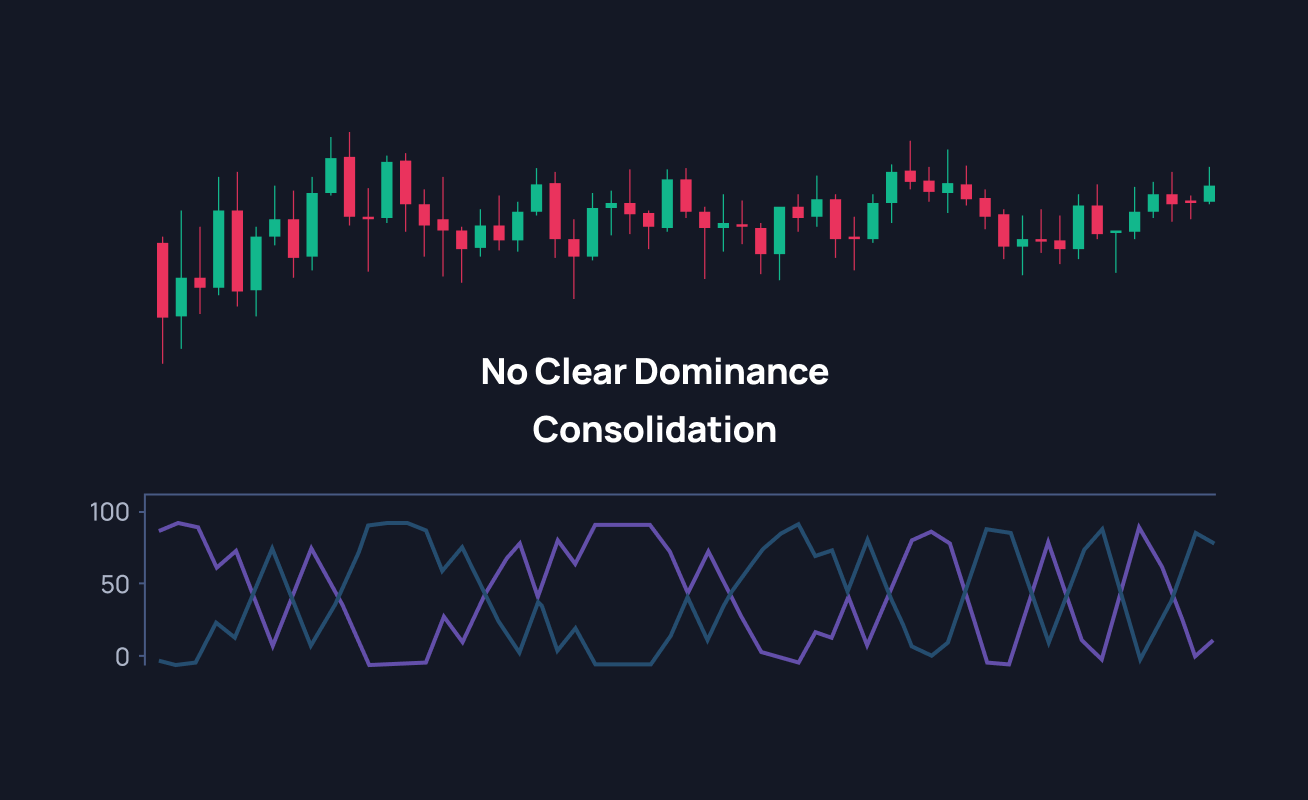
Funciona mejor cuando se combina con otras herramientas de confirmación, como:
- Medias móviles: ayudan a confirmar la dirección general de la tendencia
- ADX (Índice Direccional Promedio): mide la fuerza de la tendencia y filtra señales débiles
- RSI (Índice de Fuerza Relativa): identifica condiciones de sobrecompra y sobreventa
Combinar estas herramientas ayuda a determinar si el Aroon refleja fuerza real del mercado o solo ruido temporal.
El indicador Aroon muestra claramente la fuerza de la tendencia — no solo la dirección, sino también cuánta “energía” le queda. Al seguir el tiempo de los máximos y mínimos, ayuda a identificar cuándo el impulso se está formando, debilitando o posiblemente revirtiendo.
Agrégalo a tu caja de herramientas como un chequeo de salud de la tendencia. Usado junto con otros indicadores, puede ayudarte a entrar antes, salir mejor y operar con más confianza en sintonía con el ritmo del mercado.