- التعليم
- تحليل تقني
- المتوسطات المتحركة
Moving Averages
You can use technical indicators to analyze price chart patterns and estimate future price movements. These indicators are software tools that utilize various statistical and probability methods to interpret price chart data and present the findings in graphical formats. By installing these indicators on a price chart and configuring the required parameters, you can address the question of potential price movement. These indicators greatly simplify the process for novice traders, providing an additional analysis tool. The primary objective when using indicators is to comprehend their settings and signals. One of the simplest indicators is the moving average.
The moving average is a line indicator that enables you to observe the average value for a specific interval directly on the price chart.
This indicator calculates the average value for a defined number of candlesticks or bars and presents the outcome as a point on the chart. For instance, the moving average with a period of 14 considers the last 14 candlesticks, adds up their closing prices, and divides by their total count. A new point emerges with the arrival of each new candlestick. An example of the moving average on the chart is provided below:
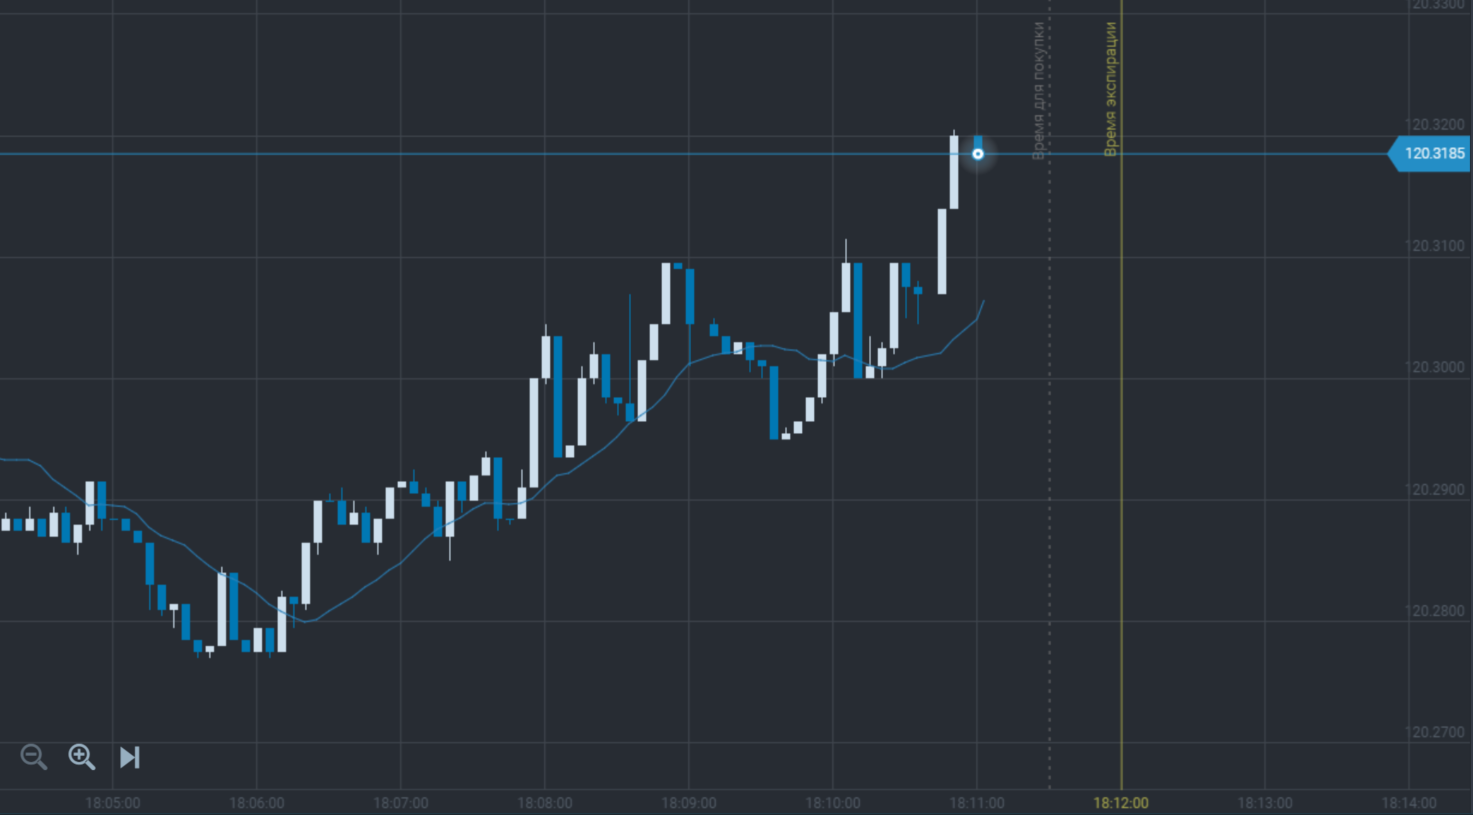
The moving average is a trend indicator which highlights trading cues on the uptrends and downtrends.
There are several types of moving averages depending on a calculation method:
1) Simple moving average is the average value for a specified period;
2) Weighted moving average is the average value calculation which includes a “weight” of the value considering its closeness to the current price, where the closest price is the heaviest one and the most distant price has the lowest weight;
3) Exponential moving average is the average value is calculated for a specified period by adding a definite share of the current price to the previous value and the share considers the price “weight”;
4) Smoothed moving average is calculated as the simple moving average for every previous value.
The moving average settings when added to the chart will be as follows:
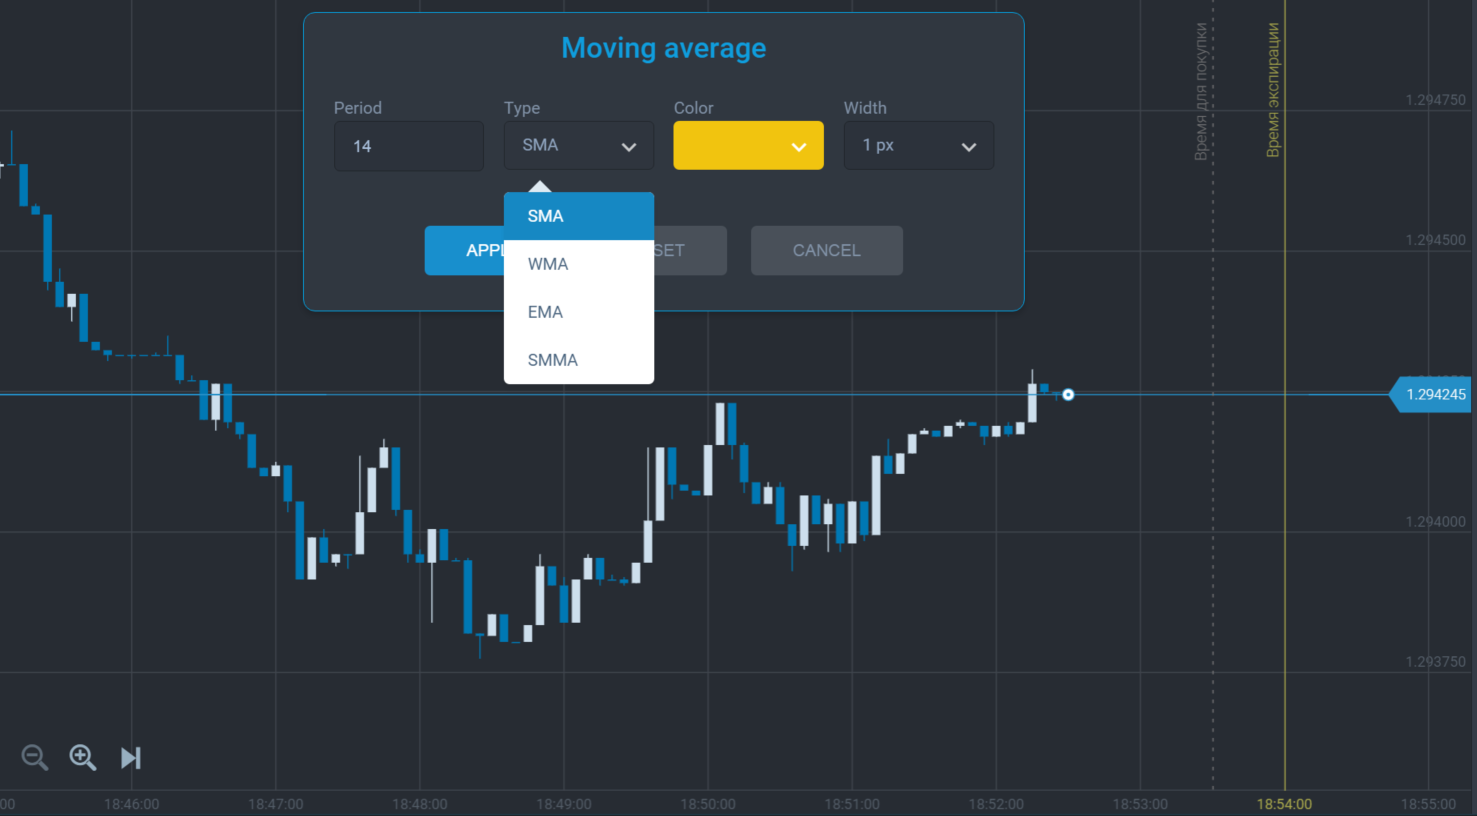
You should not be afraid of complications in the moving average calculations as there is no need to know all formulas when using them. It would be best if you remembered only the signals they give. Different types of moving averages with the same settings are not much different on the chart. The formula of the moving average calculation is important for trading systems with fine settings. We will need only the simple moving average as an initial instrument for online trading.
There are some ways to use this indicator on the chart. The simplest one is to receive a signal when the price chart crosses the moving average:
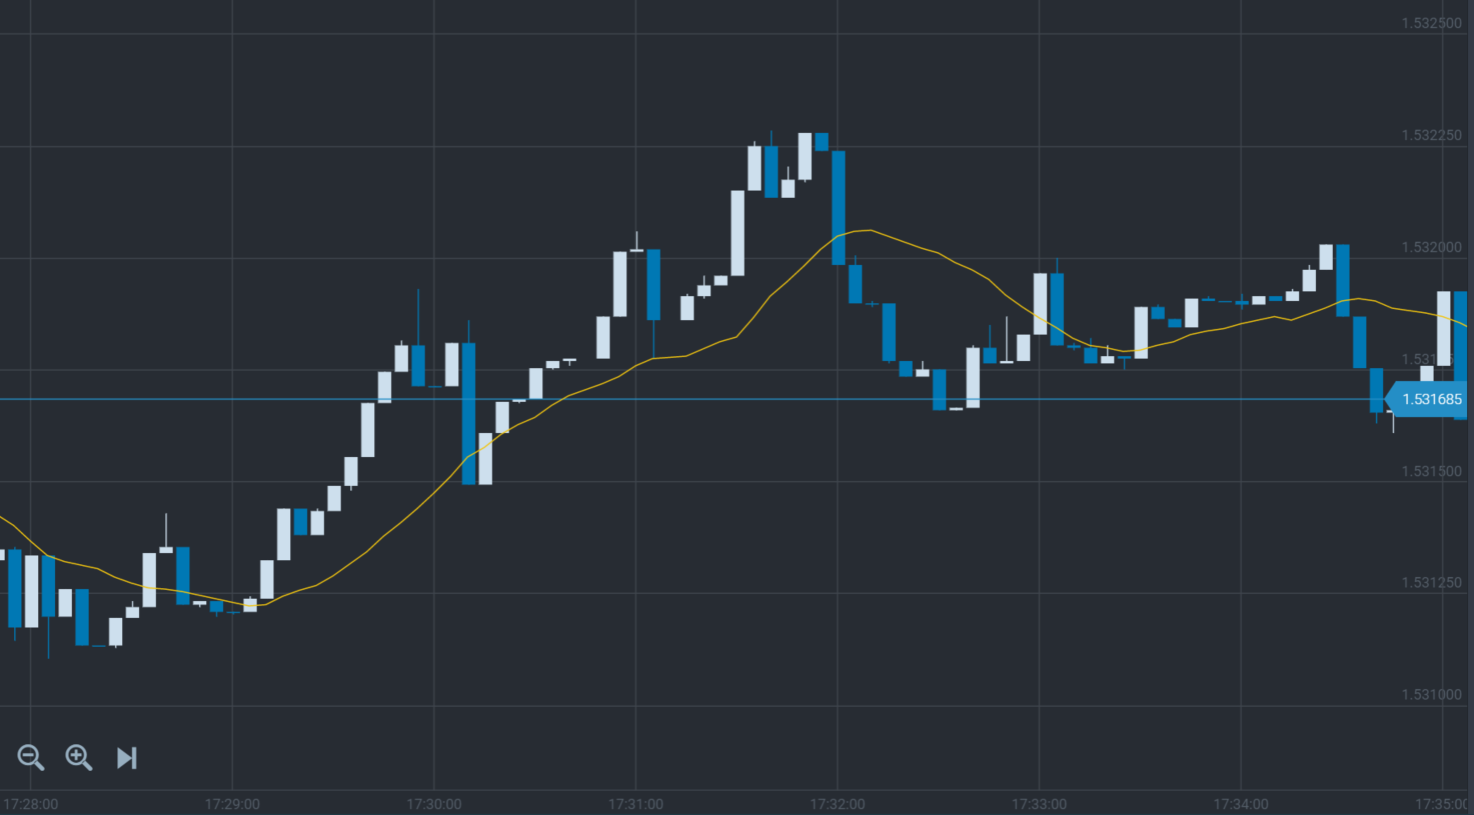
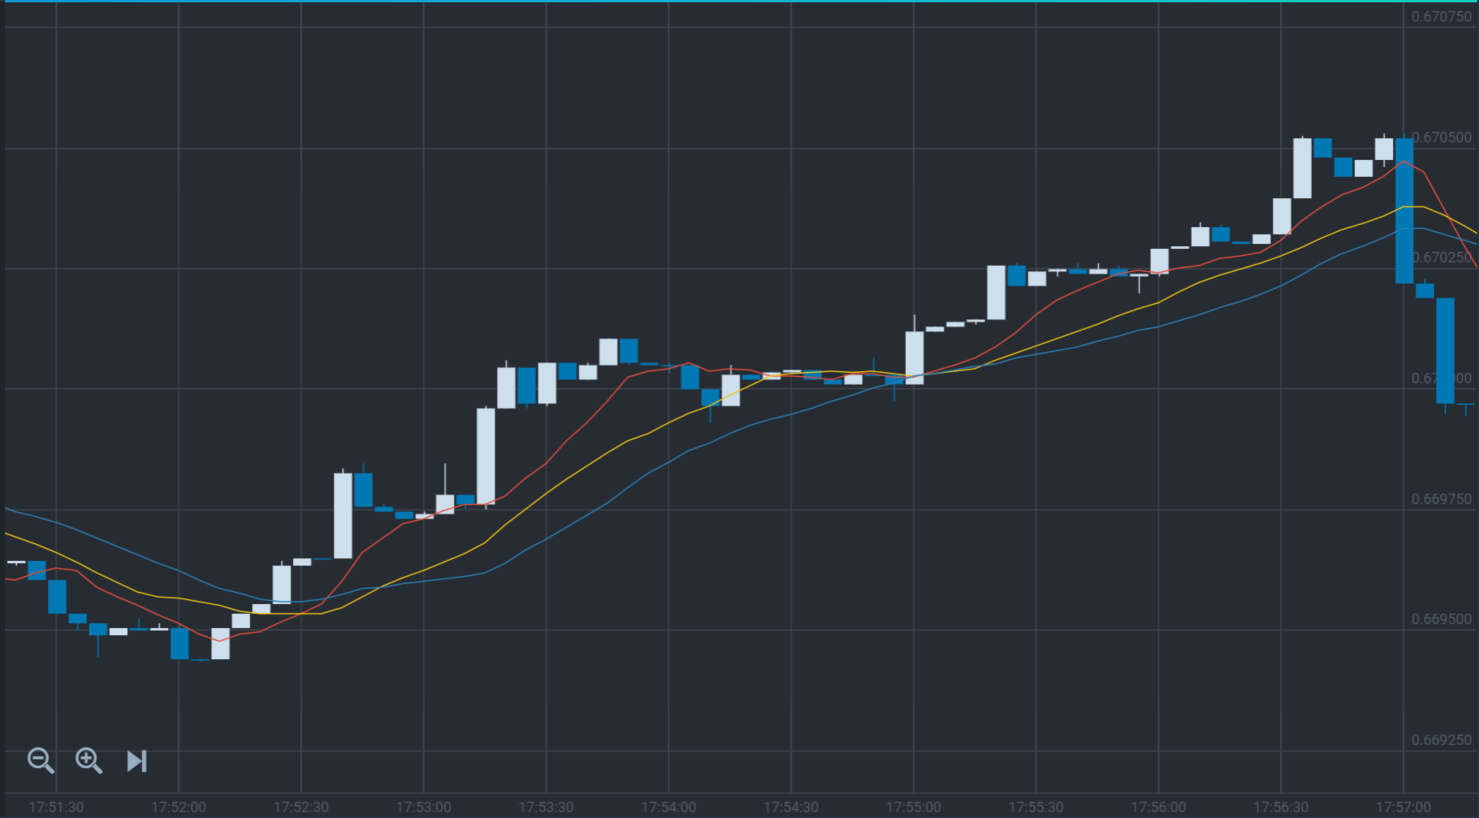
As we can see in the picture a signal to trade appears when the price line crosses below the moving average, and a signal to trade also appears when the price line crosses above the moving average. You can also use some moving averages to receive more accurate signals. You can use three simple moving averages with periods 7, 14, and 21 to receive the truer signal. When the price chart crosses SMA (7) below it will be the main signal that the tendency direction is being changed and you should prepare to buy. The price continues moving upwards and SMA (7) following it will cross SMA (14) below because the moving average with the shorter period responds to the tendency to change quicker. It gives us a second signal and the first confirmation that price movement has changed its direction. Some fresh traders can start buying here but as the period is less than a minute, there can be many false signals. So after our SMA (14) has been crossed by the price chart and faster moving average it also starts curving upwards following the price. When it has crossed the slowest SMA (21) below we will see the next signal and second confirmation to buy. And at this moment we can buy call options. In the following picture you can see the example:
The challenge in using long-term moving averages lies in their inherent lag, making them more suitable for confirming trading cues. Additionally, long-term MAs can function as support and resistance levels within the existing trend, providing supplementary buy or sell signals.
As we can observe, moving averages are user-friendly and provide reliable trading cues. Using various indicators with different periods on the chart is convenient and enhances opportunities for successful trading. Moving averages serve as effective trend indicators, pinpointing moments of changes in price chart direction. However, it's important to note that this indicator may not generate effective signals during periods of market consolidation. Fortunately, sideways trends are relatively uncommon and short-lived occurrences in the market. So the moving average remains a straightforward and uncomplicated indicator.
It's simple! Watch a short video of how it works on ExpertOption: